OPFI Ranks #1 Dilution Risk — Insider Selling, 9x Leverage, and 73% Decline Probability Signal Caution
OppFi Inc. (OPFI)
Date: February 12, 2026
Rating: HIGH RISK
Executive Summary
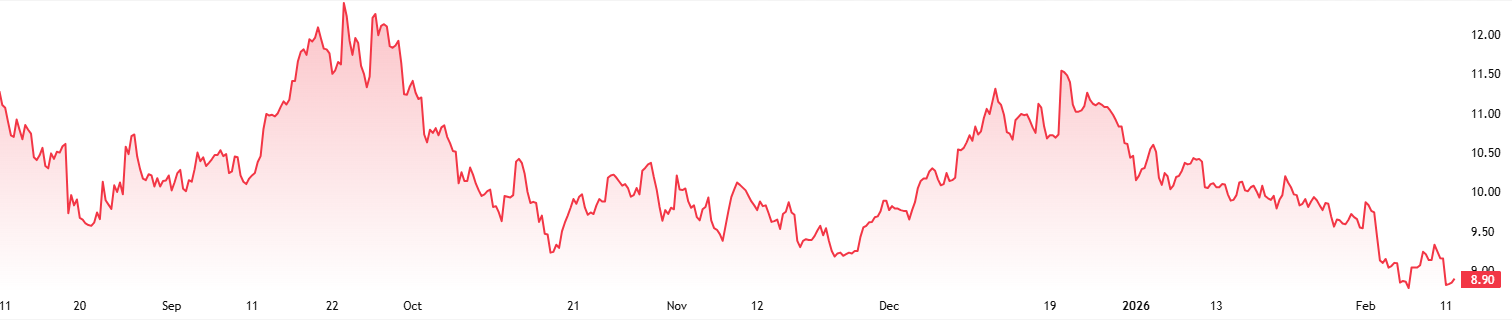
OppFi Inc. (NYSE: OPFI) ranks first in our 184-stock dilution risk universe with a composite risk score of 0.0483. The model assigns a 73.2% probability of a material price decline within 20 trading days, with an expected magnitude of -21.6%. The stock trades at $9.16, down 12% over 20 days and 22% below its 52-week high. Heavy insider selling, elevated short interest (7.7 days to cover), significant warrant overhang, and a high debt-to-equity ratio of 9.0x converge to create an unfavorable risk profile.
Company Profile
| Ticker | OPFI (NYSE) |
| Sector | SIC 6199 — Finance Services |
| Market Cap | $799.7M |
| Price | $9.16 |
| Float | 78.6M shares |
| Shares Outstanding | 87.3M |
| Avg Daily Volume (20 days) | $5.0M |
OppFi operates as a financial technology platform facilitating personal loans to consumers with limited credit histories. The company went public via SPAC merger in 2021.
Risk Scoring
| Risk Score | 0.0483 |
| Universe Rank | 1 / 184 |
| Tier | Top 1.0% |
| Projected 1-day price decline | 34.6% |
| Projected 5-day price decline | 43.7% |
| Projected 20-day price decline | 73.2% |
| Expected Magnitude (20 days) | -21.6% |
| Prediction Date | Feb. 12, 2026 |
The 20-day probability stands at 73.2% — the highest in our universe. The model expects a drawdown exceeding 21% over that horizon. The 5-day probability of 43.7% suggests the decline may begin in the near term.
Technical Picture
| 5-day Return | -6.2% | Bearish |
| 20-day Return | -12.0% | Bearish |
| 50-day Return | -5.0% | Bearish |
| RSI (14 days) | 35.9 | Approaching oversold |
| MACD | -0.329 | Below signal line |
| Bollinger %B | 0.15 | Near lower band |
| 20-day Volatility | 2.0% daily | Elevated |
| Price / 52-week High | 78.1% | 22% off highs |
| Volume Spike | 0.62x | Below average |
The stock trends downward across all measured periods. Relative Strength Index (RSI) at 35.9 approaches oversold territory, but the Moving Average Convergence/Divergence (MACD) remains negative, and the price sits near the lower Bollinger Band. A volume spike has not yet materialized, which suggests the selling has been orderly rather than capitulatory.
Dilution & Capital Structure
Active Shelf Registration
| SEC File Number | 333-258698 |
| Form | S-1/A |
| Effectiveness Date | March 7, 2024 |
| Expiration Date | December 6, 2026 |
| Total Capacity | $116.3M |
| Remaining Capacity | $113.6M |
| Utilization | 2.3% |
The shelf retains $113.6M in unused capacity — 14.2% of the current market cap. This capacity expires in ten months. The company has barely drawn on it, which leaves substantial room for future dilutive issuance.
Warrant Overhang
Two outstanding warrant tranches totaling 7.7M shares (9.8% of float):
| Tranche | Shares | Exercise Price | Issue Date |
|---|---|---|---|
| 1 | 3,848,750 | $11.50 | Sep. 29, 2020 |
| 2 | 3,848,750 | N/A | Oct. 2, 2020 |
Both tranches originated from the SPAC transaction. At $9.16, the $11.50 warrants sit 25% out of the money. A rally toward the exercise price would introduce dilution pressure.
Debt Profile
| Debt / Equity | 9.0x |
| Altman Z-Score | 0.13 |
The Altman Z-Score of 0.13 falls deep in the distress zone (below 1.81). Although specialty finance companies carry high leverage by nature, this score signals that any credit deterioration could force the company to raise equity capital quickly — at a discount.
Short Interest
| Settlement Date | Short Position | Change | Days to Cover |
|---|---|---|---|
| Jan. 30, 2026 | 4,099,075 | -282,186 (-6.4%) | 7.72 |
| Jan. 15, 2026 | 4,381,261 | -54,085 (-1.2%) | 8.38 |
| Dec. 31, 2025 | 4,435,346 | 183,464 (4.3%) | 8.40 |
Short interest stands at 5.2% of float with 7.7 days to cover. Although the position has declined modestly since year-end, the days-to-cover remain elevated — a covering event would take nearly eight full trading days at average volume. The short volume ratio over 20 days is 35.6%.
Composite Scores
| Short Conviction | 0.53 | Moderate-to-high conviction among shorts |
| Insider Sentiment | 0.71 | Strongly negative (heavy selling) |
| Overhang | 0.21 | Moderate warrant/convert overhang |
| Liquidity Stress | 0.15 | Low liquidity stress |
| Dilution Velocity | 0.00 | No active dilution in progress |
Insider Activity
100% of insider transactions in the past 90 days have been sells. No insider has purchased shares.
| Date | Insider | Title | Code | Shares | Price |
|---|---|---|---|---|---|
| Feb. 3, 2026 | Johnson, Pamela D. | CFO | F (tax) | 541 | $9.73 |
| Feb. 3, 2026 | McKay, Christopher J. | Chief Risk Officer | F (tax) | 363 | $9.73 |
| Jan. 5, 2026 | Johnson, Pamela D. | CFO | S (sale) | 5,084 | $10.24 |
| Jan. 2, 2026 | Schwartz, Todd G. | CEO | F (tax) | 3,048 | $10.30 |
| Jan. 2, 2026 | McKay, Christopher J. | Chief Risk Officer | F (tax) | 4,065 | $10.30 |
| Jan. 2, 2026 | Johnson, Pamela D. | CFO | F (tax) | 4,355 | $10.30 |
| Dec. 12, 2025 | Schwartz, Theodore G. | Director | G (gift) | 186,737 | — |
| Dec. 11, 2025 | Moore, Jocelyn | Director | S (sale) | 4,464 | $10.91 |
| Nov. 21, 2025 | Moore, Jocelyn | Director | S (sale) | 20,200 | $9.23 |
| Nov. 3, 2025 | McKay, Christopher J. | Chief Risk Officer | S (sale) | 1,107 | $9.85 |
Key observations:
- CFO sold 5,084 shares on Jan. 5 at $10.24 — a voluntary open-market sale, not a tax withholding.
- Director Moore sold 24,664 shares across two transactions in November and December.
- Theodore Schwartz (director, 10%+ owner) gifted 186,737 shares on Dec. 12 — an unusual transfer that reduced his direct holdings to 12,907. Large gifting by a major holder sometimes precedes further dispositions.
- McKay's Nov. 3 sale was under a 10b5-1 plan, indicating pre-planned selling.
Our leading indicator model flags "Insider Exodus: 100%" selling as a risk signal.
Beneficial Ownership & Network Risk
| Total Beneficial Owners (5%+) | 10 |
| Passive Holders | 10 (all beneficial owners) |
| Activist Holders | 0 |
| Total Beneficial Ownership | 73.9% |
| Max Single Position | 7.7% |
| Recent 13D/G Amendments (90 days) | 3 |
| BO Exit Velocity (90 days) | 6.8 |
The beneficial owner exit velocity of 6.8 over 90 days indicates active position adjustment among major holders. Three schedule amendments in the past quarter confirm ongoing portfolio activity.
Investment Adviser Risk (Form ADV)
| IA Owners with Form ADV Filings | 9 |
| ADV Composite Risk | 0.34 |
| Regulatory Disclosure Count | 716 |
| % Owners with Regulatory Disclosures | 88.9% |
| % Owners with Civil Disclosures | 11.1% |
Nearly nine out of ten institutional owners have regulatory disclosures on their Form ADV filings. The aggregate regulatory disclosure count of 716 across these firms is high, though many large asset managers carry regulatory history by virtue of scale. The unified IA risk score of 0.18 reflects moderate concern.
Ownership Network Analysis
| Issuer Degree | 527 |
| Issuer PageRank | 0.043 |
| Issuer Betweenness | 1.000 |
| Connected Issuers | 2,779 |
| Syndicate Size | 58 |
| Shared Owners w/ Other Issuers | 19 |
| Bad Actor Score | 0.17 |
OPFI sits at maximum betweenness centrality (1.0) in our ownership network — it occupies a bridge position connecting disparate clusters of issuers. The syndicate of 58 issuers sharing common ownership creates potential correlation in dilution timing. The bad actor score of 0.17 is low.
Event Cadence
| Lifetime Offering Events | 9 |
| Events Per Year | 1.7 |
| Mean Time Between Events | 175 days (all-time), 139 days (2y) |
| Regularity CV | 1.74 (irregular) |
| Max Gap | 968 days |
| Recent Gap vs. Average | 0.79x (slightly below average) |
| Shelf Exhaustion Rate | 0% |
| Shelf Months to Zero | 120 (no draw projected) |
The cadence model indicates irregular but recurring capital-raising activity. The 2-year mean-time-between-events of 139 days suggests that the next event may occur within the shelf's remaining life. The nearly untouched shelf capacity ($113.6M) provides ample room.
Financial Quality Signals
| Altman Z-Score | 0.13 | Severe distress zone |
| Piotroski F-Score | 5 | Neutral |
| Accruals Ratio | -0.245 | Negative (favorable) |
| Beneish DEPI | 4.41 | Elevated depreciation index |
| Beneish AQI | 0.98 | Normal asset quality |
| Beneish LVGI | 0.95 | Stable leverage growth |
The Altman Z-Score is the most alarming metric here. At 0.13, it sits far below the 1.81 threshold that separates distress from stability. The Piotroski score of 5 is mediocre. The negative accruals ratio is a positive signal — it indicates earnings exceed cash flow adjustments.
Risk Factors Summary
Converging risks (ranked by importance):
- Insider exodus — 100% sell ratio over 90 days, CFO making voluntary open-market sales, a major holder gifting away 94% of direct holdings.
- Extreme leverage with distress-level Z-Score — D/E of 9.0x and Altman Z of 0.13 leave no margin for credit deterioration.
- Elevated short interest — 5.2% of float shorted with 7.7 days to cover. Shorts have held conviction through price declines.
- Unused shelf capacity — $113.6M (14.2% of market cap) available for dilutive issuance through December 2026.
- Warrant overhang — 7.7M shares (9.8% of float) from SPAC-era warrants.
- Downward price momentum — Negative returns across 5d, 20d, and 50d periods with RSI near oversold.
Mitigating factors:
- No active at-the-market offerings or equity line of credit programs; dilution velocity is currently zero.
- No toxic investors detected in the beneficial ownership network.
- Negative accruals ratio suggests earnings quality is reasonable.
- Short interest has declined modestly from its December peak.
Conclusion
OPFI presents a concentrated cluster of risk factors that our model ranks highest in the universe. The combination of universal insider selling, distress-level leverage, substantial unused shelf capacity, and sustained short interest creates a profile where any single catalyst — an earnings miss, a debt covenant issue, or a surprise equity raise — could trigger the 21.6% decline the model projects over 20 days. The stock deserves close monitoring for short candidates.
Data as of February 12, 2026
Nothing in this report is investment advice. Past performance does not guarantee future results. Short selling involves unlimited loss potential. Conduct independent research before trading.
Member discussion